
A new look at funnel metrics: follow the math
The idea of a sales funnel is nothing new. Anyone who’s ever worked in a sales or RevOps function knows what it looks like; everyone who’s ever taken a college-level business course understands the concept of many prospects coming into the top of a funnel and significantly fewer coming out of the smaller end on the other side. But there’s a secret that isn’t readily apparent when most people look at the sales funnel diagram—and that is, with just a little bit of fiddling inside of it, companies can significantly increase the number of customers at the end. The place to start is with how your organization understands sales funnel metrics.
It’s the old Apple Computers slogan: think different. Because when you do, you’ll see that the funnel is such a powerful mechanism that you don’t need enormous improvements to it to generate higher revenues.
But first, let’s take a look at the sales funnel.
Sliding down the funnel
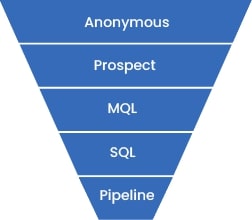
Sales funnels, at their most basic, are easy to understand. At the top, you see individuals visiting your website, but because they haven’t identified themselves through a form fill, you don’t know who they are. You only know about them from a cookie on their browser. But, when that anonymous person fills out a form on the website, that person is now a prospect. And chances are good that you’ve also captured an email address along with a name. Just like that, you can complete the profile, and match them to a company, get a phone number, or even a job title.
In the prospect phase, the marketing department takes the wheel to nurture the lead. They work to educate prospects and send them more information to engage with. Based on the prospect’s behavior—did they download a white paper or attend a webinar we invited them to?—marketing sends prospects down a journey of discovery. When the marketing department is satisfied that the prospect is showing enough interest, the prospect moves to the next stage in the funnel: MQL or marketing-qualified lead.
Digging a little deeper with the sales team
Now, sales get involved. Their initial move is to investigate further to determine if the MQL is worth their time. After contact, if the sales team believes the MQL is worth investing in sales resources, it becomes an SQL or sales-qualified lead. If, after even more tracking, the sales team thinks the SQL might turn into a deal, it becomes known as an opportunity.
Opportunities become part of a pipeline. And here’s where starting to think differently about the funnel comes in. The funnel we’ve been describing applies only to new business. But most companies have return customers who don’t go through this funnel every time they buy. They’re in a parallel universe, going down a funnel for upsell and cross-sell. And if you work with partners, a second funnel for channel sales operates next to upsell and cross-sell.
The dynamics inside a funnel
If your company intends to grow, given the static nature of the sales funnel, there are only three ways to make that happen:
- Improve your conversion rates—increase the number of leads that turn into opportunities, and the number of opportunities that turn into customers.
- Increase the size of the deals sales close.
- Raise the velocity—in other words, reduce the amount of time it takes to close a sale.
To increase conversion rates, you need to work more efficiently. Ask yourself: out of every MQL, how many turn into SQLs? If 10% convert at this stage, what could you do to double that? You can reap 20 SQLs from the same 100 you started with if you do. But how?
The second action you could try is increasing size. If you can double your deal size, your funnel also doubles with the same number of prospects. And that means either boosting the number of sales you close or increasing the dollar value of each sale.
The last option is velocity. In this scenario, the question is, ‘How can we close deals faster?’ If you can close the deal in 60 days instead of 120 days, your funnel can be much smaller to get the same results. Why?
Because those are the only choices available, it’s time to get creative with math.
Introducing the magic of funnel math
Remember in elementary school when teachers told you that math was fantastic magic? You probably didn’t believe them and gave them your best side-eye. And then those teachers showed you something so unique with math that it took your breath away. Then, you were hooked. Here’s another bit of math magic for RevOps that could make you rethink your entire funnel.
It stands to reason that only a certain percentage of people who enter a funnel come out the other side as customers. Naturally, funnels are larger on the top and small at the bottom. With a database of two million leads at the top, you may see only 100 or so opportunities at the lower third. The percentage that moves from stage to stage is the conversion rate.
Say hello to SaaSco. SaaSco is a mythological but prevalent type of SaaS company with the following stats:
- Annual Recurring Revenue: $50 million run rate
- Net revenue retention: 110%
- Upsell rate at the beginning of the year: 10%
So that’s net revenue retention of 110%, and they have a year-over-year growth rate of 50%.
However, SaaSco needs to grow even more. By the end of the year, they want to be at 50% higher AR than at the beginning. How will they do it? Taking only three simple pieces of data, they do a calculation that looks like this:
- Target growth: 50%
- Starting point: at $50 million AR
- The company must add $25 million worth of business.
Where is that 25 million going to come from? We’ll focus on the install base and new business in this case. Of that 25 million, 5 million comes from the upsell/cross-sell (you know that because you have the customer retention number). That means the rest of it has to come from new customers.
Imagine now that you’re a sales rep at SaaSco and responsible for generating $20 million AR this year; it’s up to you to figure out precisely what you need to do. Start with your conversion rate. Typically, customers use 4x as their coverage number, but to be conservative, you go with 5x.
- Percentage of sales closes from the pipeline: 20%
- Qualified pipeline = five times $20M =$100M
To achieve $20M in booking, you’ll need to have $100 million coming in during the year. So what does that mean for your SQLs? Going with your calculation of a 50% close rate from Stage 3 in the funnel, you’ll need $200M in Stage 1.
So, as you can see, coming up with these numbers is straightforward: every stage takes the output you need, divided by the conversion. But we’re not finished climbing back up that funnel yet. We still have to think about MQLs. Going back to your 20% conversions between MQL and SQL, you need to figure another five X coverage. And that means you’re looking at a considerable number. To get a $200 million Stage 1 pipe, you need to generate a billion dollars of MQLs.
When looking down the pipeline at numbers like that, you’d probably find much value in strategies that could help you get there. And the answer comes in the most surprising of ways: baby steps.
If there’s a solution that can improve your MQL by 10%, it’s a modest, achievable improvement. But here’s where it gets interesting: those small, incremental jumps start to add up. So let’s start with an example from the MQL stage.
The compounding effect in funnel metrics
The numbers start to jump when RevOps makes minor tweaks to the pipeline. If they improve their lead scoring, grading, and clean up the data, the company will probably see a 10% gain. RevOps can also use the solution to improve the quality of MQLs through scoring, engaging, intent signals, or a better profile. You can improve the conversion rate from MQL to SQL by 3%. Again, this isn’t a massive improvement.
But you have a colossal number hanging over your head. A billion dollars. If you add just 3% to a billion dollars, you went from the previous $200 million to 253 million. Intrigued now? We’ve just gotten started. Because of the compounding effect:
- You improve MQLs by 10%,
- You improve conversion by 3%.
- Your output went from $200M to $253M. That’s a 1025% increase in your SQL output.
Back up at the SQL to Stage 1, where the conversions used to be 50%. Now we’re going to bump you up modestly—to 55%, which is not a huge jump. That’s 139,000,000, almost 40% higher than the previous number just from the compounding effect as it makes its way down the funnel.
A few more minor tweaks, and…
The next area to target for improvement is deal conversion. If you can get even 2% more sales from automating and improving nurturing, beta, and ABM with the much larger number you’ve now calculated, 139,000,000, and multiply it by 22%, you’ll see an impressive figure—$31M in bookings.
By adding $11 million of new AR, sales can add $100M to the company’s valuation without making nearly impossible asks from your sales team. But the improvements you make are significant enough to realize a major gain to the company valuation. The addition takes place in RevOps, through sales funnel automation, and the key is making the data coming into the funnel better. Compounding the gains at each stage of the funnel, the AR that comes out at the end is much greater. While we mainly focused on the new sales pipeline here, you’ll recall that the partner sales channel and upsell resell are also part of the entire funnel—and the same tactics and techniques discussed here for new sales also apply to the channels.
Once again, like that day when math first grabbed you, you see the hidden power in numbers. Tiny, incremental changes lead to huge gains in sales funnel metrics. A company CGO may only care about the big numbers, but for people who do the day-to-day work, it’s far more satisfying to follow the funnel math.
Recommended resources