
Calculating data enrichment ROI: everything you need to know
Calculating data enrichment ROI should be simple. Better leads mean higher conversion rates, and therefore more revenue. Right?
While seemingly straightforward, how best to measure the ROI of your company’s projects and initiatives remains a mystery to many revenue operation leaders and, perhaps more importantly, to the finance teams that often need to greenlight and fund such projects.
In this blog, we’ll walk through the various models used to calculate ROI for enrichment of your data records.
Importance of setting your data enrichment ROI goals
Data enrichment is a no-brainer; a necessity that nearly all B2B companies undertake. It’s so obvious that most companies never set any goals or criteria for revenue or productivity when they embark on enrichment.
This is a mistake. It’s important to measure and track your progress when it comes to enrichment. One big reason is because your data enrichment is not a “one and done” affair.
Not only will you want and need to do ongoing enrichment, but also there will be newer signals or data attributes that your business will want to buy, ingest, and leverage. This will require a new budget and approvals. And if you’ve been lazy in tracking the upside or ROI of your current enrichment efforts, why would your CFO approve additional funds to do more?
Understanding data enrichment ROI: hard and soft
It’s useful to create two main categories when breaking down data ROI.
The most important group is the one that details the metrics that recognize direct revenue gains, or “hard” contributions. These could include:
- Higher conversion rates
- Average contract value (ACV) increases
- Sales rep and SDR productivity
- Bigger pipeline per rep
The “soft” contributions, while tougher to calculate the exact ROI on, are also important to include in your business plan. These might include:
- Martech and tech savings
- Reduced attrition among your sales team
- Effective lead routing
- Smarter territory planning and assignment
There are also two very strategic contributions I’ll highlight:
- Tighter ideal customer profiles (ICP)
- More accurate total addressable market (TAM)
Calculating the cost contributions
Before we tackle the direct revenue basics, let’s touch on a few of the cost benefits.
Cutting martech costs
Data enrichment done right can eliminate one-quarter to one-third of your current database. That’s not surprising, as a fair amount of most companies’ data records are either duplicates, of poor quality, or don’t match the company’s ICP.
Of course, sales and RevOps folks often use more colorful words to describe the quality of their current database.
Since companies are often charged for their tech and marketing platforms by the size of their database, you’ll see immediate savings here. For example, if you spend $200k annually on your marketing and data platforms, it’s probably safe to plan for a 10% or more reduction in those costs due to your now smaller and more focused data set.
Accounting for sales rep attrition
It’s no exaggeration to say that this is the most overlooked element of the data enrichment records ROI model.
It’s not uncommon for growth B2B companies with both SDR and AE teams to have a monthly attrition rate of 2% to 3%. Multiply that over 12 months and you’re looking at a turnover of your sales force of anywhere from 25% to 35%.
Now, ask yourself what a fully-ramped sales rep does in revenue or sales either quarterly or annually versus to a newly-hired rep. Typically, it takes anywhere from three to five months for a rep to fully ramp up.
A study by the Society for Human Resource Management (SHRM) estimates that a company will have to spend anywhere from six to nine months of that employee’s salary to find and train a replacement, while reducing attrition can add as much as 10% to each sales rep’s top line.
Bottom line, if you can improve lead quality and focus through a thoughtful enrichment strategy you add that 10% contribution to your business plan.
Implementing the Good/Better/Best framework
It’s helpful to settle on a framework to capture your revenue upside. By this, I mean that you’ll want to include a range in estimating your ROI.
Let’s look at engagement, like conversions or demos booked, as an example.
Suppose your hypothesis is that the number of demos your sales team books should increase anywhere from 5-15% based on better data and focus on the “best-fit accounts.”
Laying out three sets of calculations in the Good/Better/Best framework enables you to build consensus as your finance and leadership teams can select the scenario that they feel most comfortable with.
- In the below example, we use:
- Universe of 50,000 accounts
- ACV of $35,000
- Demo rate from 2% to 2.8%
- Current close rate of 15%
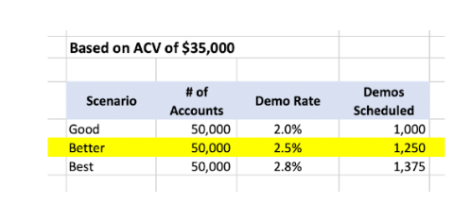
Admittedly, we’ve used a low demo conducted rate. You can adjust this percentage based on your own business metrics.
Next, we’ll continue building out our Good/Better/Best construct by increasing the demos booked rate to 15%. We’ll also adjust the close rate, which is normally 15% under the good scenario, and 18% and 20%, respectively, in the better and best scenarios.
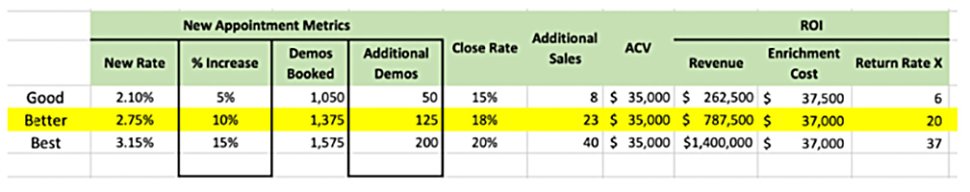
As you can see, the formula results in revenue increases anywhere from $262k to $1.4M.
The cost of the enrichment based on enriching 50,000 accounts is just $37,000 whichever scenario you select.
Bottom line, ROI ranges from 6x in the good category to 20x and 46x, respectively, in the better and best categories.
If your leadership and finance teams agree to use the better category, then everyone should be satisfied with the 20x ROI and your data enrichment project should get funded quickly.
Including pipeline and lead lists
As they say in the TV infomercials, “but wait, there’s more…”
Another healthy data enrichment ROI indication is the pipeline worked by your sales reps.
When done correctly, data enrichment can have two results:
- Fewer prospects worked
- More and higher quality pipeline
Did we just say a decrease in the number of prospects? Isn’t that a bad thing?
Think again. With your data enrichment records, you should be able to significantly pare down the number of accounts your marketing team includes in its outreach and the number of companies your sales reps have to chase or waste their time on.
The result:
- A smaller pool of qualified accounts
- Less waste in terms of outreach
- Higher qualified pipeline
- Increased conversion rates
Racking up big strategic wins
So, you’ve successfully enriched your data records, cleaned up the mess that is your “CRM,” and in the process, raised the conversion rates and the pipeline of your sales organization.
But perhaps the two biggest wins that you’ve driven for your company can’t be assigned a numeric year-over-year value. Yet, one can argue these are the most strategic things that you can get right.
If your company is like most, your marketing and sales teams engage in heated discussions over your ICP. Even successful and well-funded companies still question whether they truly have their ICP figured out.
Of course, it’s hard to narrow down your ICP unless you fully understand the profile of both your best-fit and worst-fit customers. You’ll need to go beyond the superficial data fields like industry and company size to figure this out.
A comprehensive data enrichment project helps provide the data you need to create a detailed and accurate reading of your ICP.
And guess what? Nailing down your ICP also unlocks another strategic win for you: your TAM, which is definitely a topic worthy of its own post.
And let’s be honest, TAM is the key to determining your company’s growth potential. It drives everything from investment to product strategy.
No doubt you’ve heard your CEO talk passionately about your company’s TAM. Understandably, it’s a constant topic for the C-suite and the company’s board. But all too often, a company’s TAM is not built or measured using the bottom-up approach. Most companies instead rely on top-down industry level numbers that, while directionally accurate, do not have the same accuracy that comes from doing a thorough product-specific TAM analysis.
A well-executed data enrichment strategy can provide the needed data to lock in your company’s ICP and its true TAM. You can register here to see the Enrichment ROI calculator in action.
Ready to find out how your data stacks up?
Speak with an Openprise data enrichment solution specialist for a data review and discover how a multi-data vendor strategy can ensure you get the data and return your business demands.
Recommended resources